Output
Source
using namespace arma;
{
gp.
window(
"Filter plots", 10, 10, 700, 700 );
vec Mg( 1024 );
vec Ph( 1024 );
vec a, b;
a = { 1 };
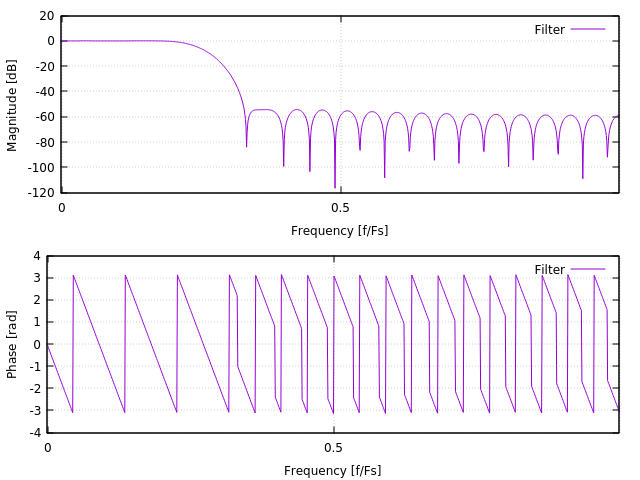
b = fir1( 44, 0.25 );
Mg = 20 * log10( freqz( b, a, 1024 ) );
Ph = phasez( b, a, 1024 );
gp.
send2gp(
"set multiplot layout 2, 1" );
gp.
send2gp(
"set xtics (\"0\" 1,\"0.5\" 512,\"1\" 1024)" );
gp.
ylabel(
"Magnitude [dB]" );
gp.
xlabel(
"Frequency [f/Fs]" );
gp.
send2gp(
"set xtics (\"0\" 1,\"0.5\" 512,\"1\" 1024)" );
gp.
xlabel(
"Frequency [f/Fs]" );
return 0;
}
void plot_show(void)
Show plots.
void grid_on(void)
Set grid.
void xlabel(const char *label)
Set label for X-axis.
void ylabel(const char *label)
Set label for X-axis.
void send2gp(const char *cmdstr)
Send command to Gnuplot pipe.
void set_term(const char *ttype)
Set output terminal.
void plot_add(const T1 &x, const T2 &y, const std::string lb, const std::string ls="lines")
Push plot y vs. x with label and linespec.
void window(const int fig, const char *name, const int x, const int y, const int width, const int height)
Configure the figure used Windows environment.

