The Gnuplot output terminal 'epslatex' generates two output files, one .eps with the actual plot and one file .tex with the text in Latex format. To include the file use \input{filename.tex}
\documentclass[11pt,a4paper]{article}
\usepackage{amsmath}
\usepackage{graphicx}
\usepackage{epstopdf}
\usepackage{xcolor}
\begin{document}
\begin{figure}
\input{test.tex}
\end{figure}
\end{document}
Output
Source
using namespace arma;
{
int N = 512;
vec x(N), y(N);
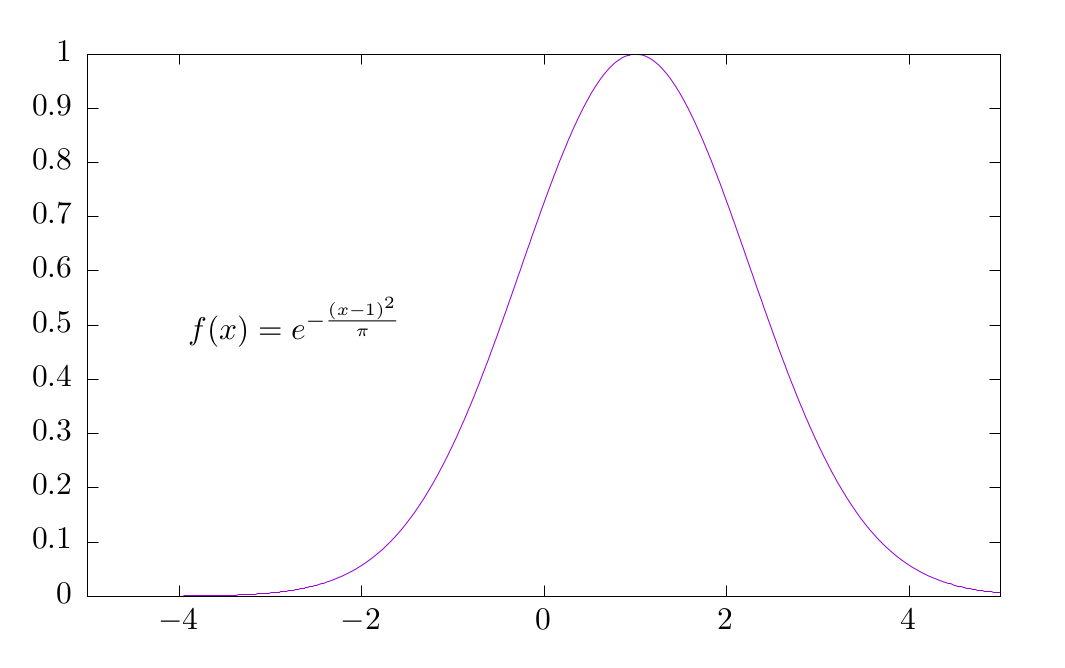
x = linspace(-5, 5, N);
y = exp(-(x - 1) % (x - 1) / datum::pi);
gp.
label(-4, 0.5,
" $f(x)=e^{-\\\\frac{(x-1)^2}{\\\\pi}} $");
return 0;
}
void plot_show(void)
Show plots.
void set_output(const char *name)
Save plot to file.
void xlim(const double xmin, const double xmax)
Set X-axis range.
void plot_add(const T1 &x, const T2 &y, const std::string lb, const std::string ls="lines")
Push plot y vs. x with label and linespec.
void label(const double &x, const double &y, const char *label)
Set label at position x,y.

